


Estimated reading time: 16 minutes
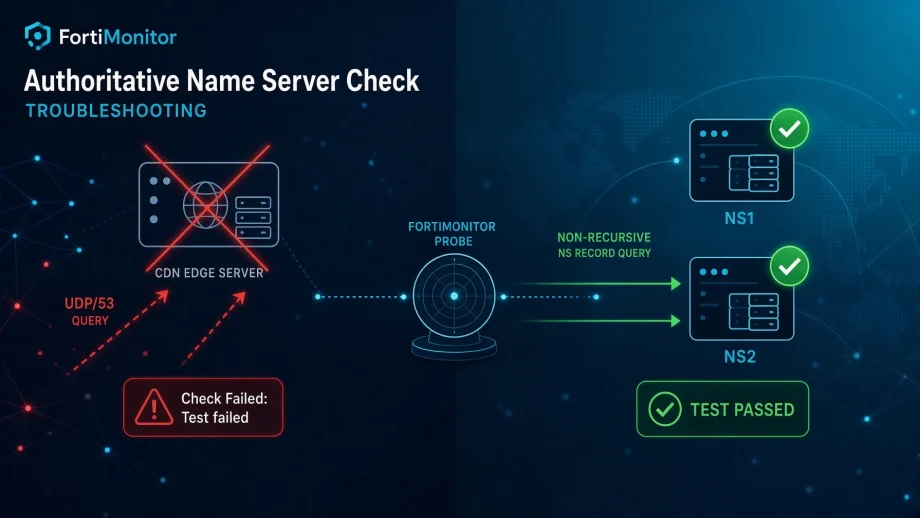
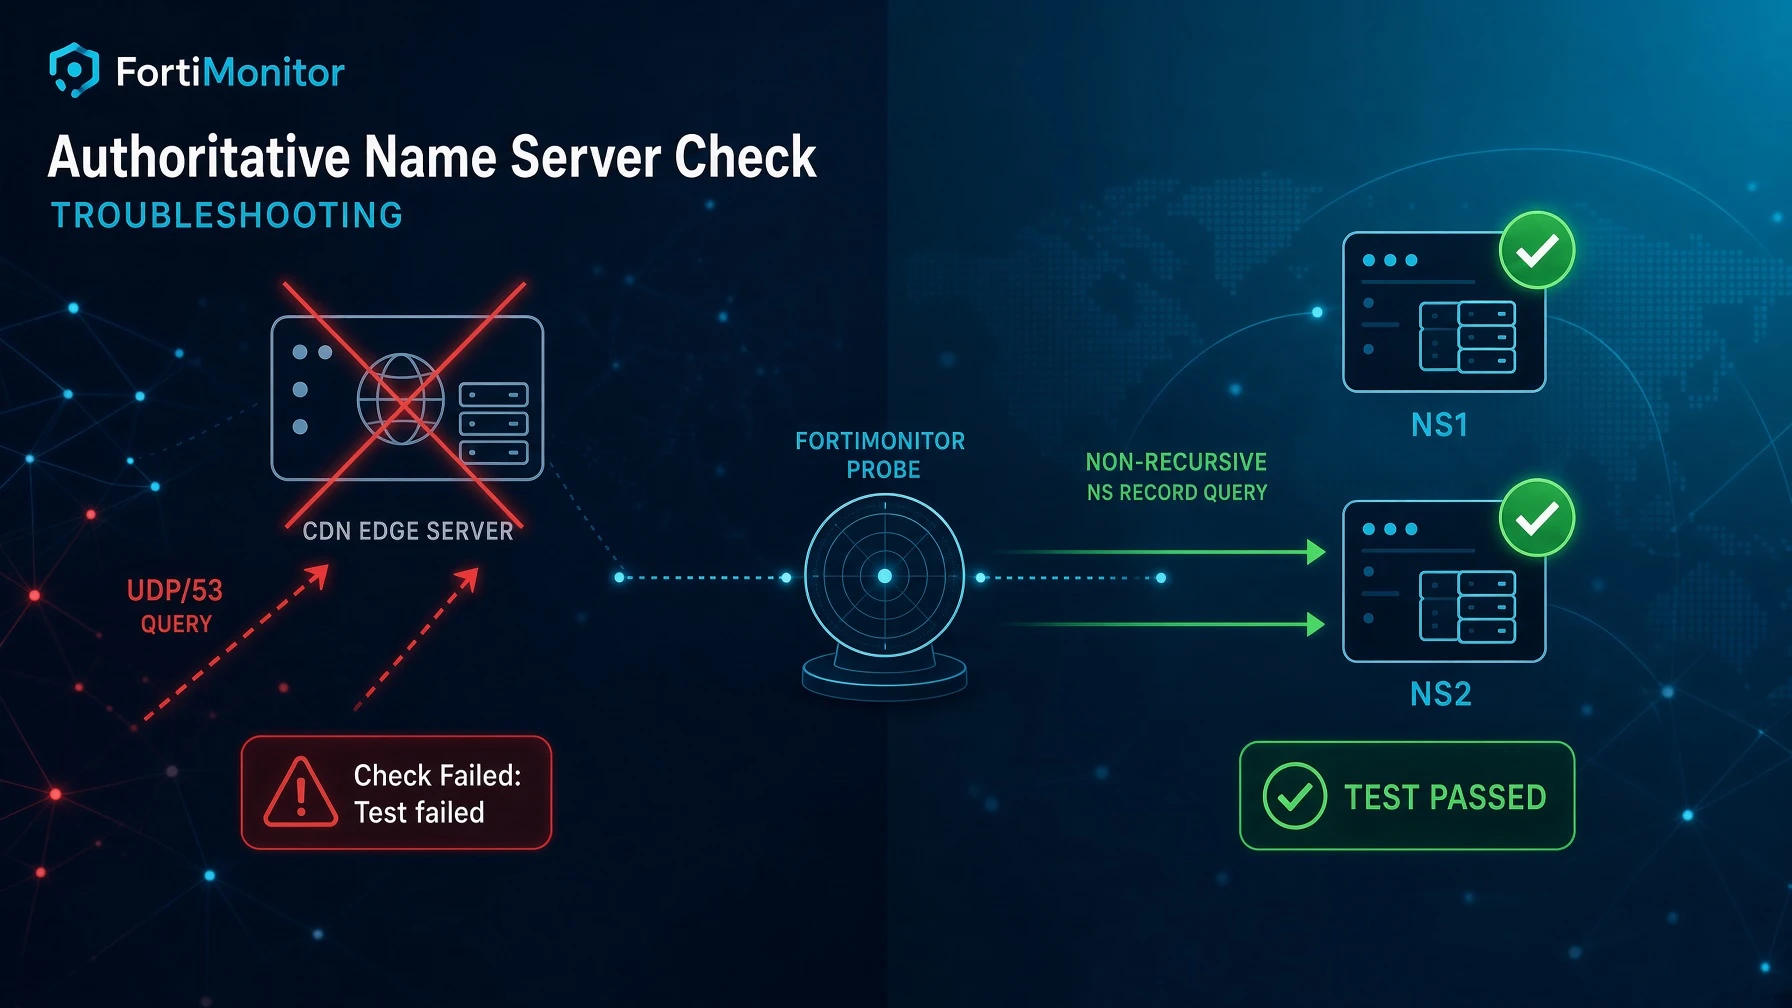
A monitoring check that was supposed to watch a domain’s NS records failed every single re-test with the uninformative message “Check Failed: Test failed.” The DNS options on the check looked perfect. Every field under Advanced → DNS Options was already set the way you would set them if you knew exactly what you were doing. Yet nothing worked. The real problem was that the check had been attached to the wrong instance. A FortiMonitor DNS Name check queries the host it is attached to on port 53, and it had been attached to the customer’s website instance whose address is a CDN edge that serves only HTTP and HTTPS. Moving NS monitoring onto instances that represent the authoritative nameservers themselves fixed it. Along the way we hit a second, genuinely nasty bug: the DNS Record Type dropdown silently reverts to “A record” on save while every other field on the same panel persists correctly.
If you are trying to figure out how to configure NS monitoring of a domain in FortiMonitor, this is the walkthrough that would have saved us roughly an hour. Most of that time was spent chasing a second, unrelated UI behavior that undoes the fix the moment you save.
Why this is worth writing about
Three things make this a better story than “I misconfigured a check.”
First, the mental model is inverted from what most people assume. Everyone who has used dig thinks of a DNS test as “ask resolver X about name Y.” Two parameters. FortiMonitor’s DNS Name check only exposes Y. X is implicit — it is whatever instance the metric hangs off. That is a reasonable design once you understand it (it makes the check a server check rather than a pure record check), but it is not what the UI leads you to expect, and the error message gives you nothing to work with.
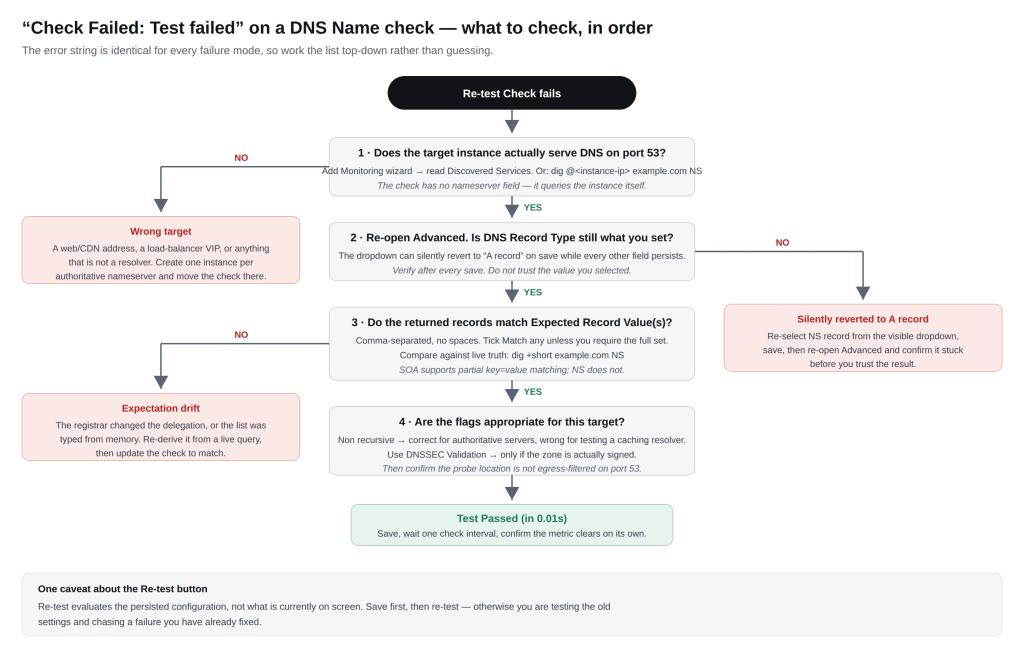
Second, the error string is identical for every failure mode. “Check Failed: Test failed” covers “nothing is listening on port 53,” “the record type doesn’t match,” “the expected values don’t match,” and “the probe couldn’t egress.” There is no differentiation, so you have to work a checklist top-down rather than guessing.
Third, there is a real, reproducible UI bug in the middle of it that will silently undo the fix you just made. Anyone learning how to configure NS monitoring of a domain needs to know about these pitfalls before they burn the same hour we did.
The inverted mental model that trips everyone up
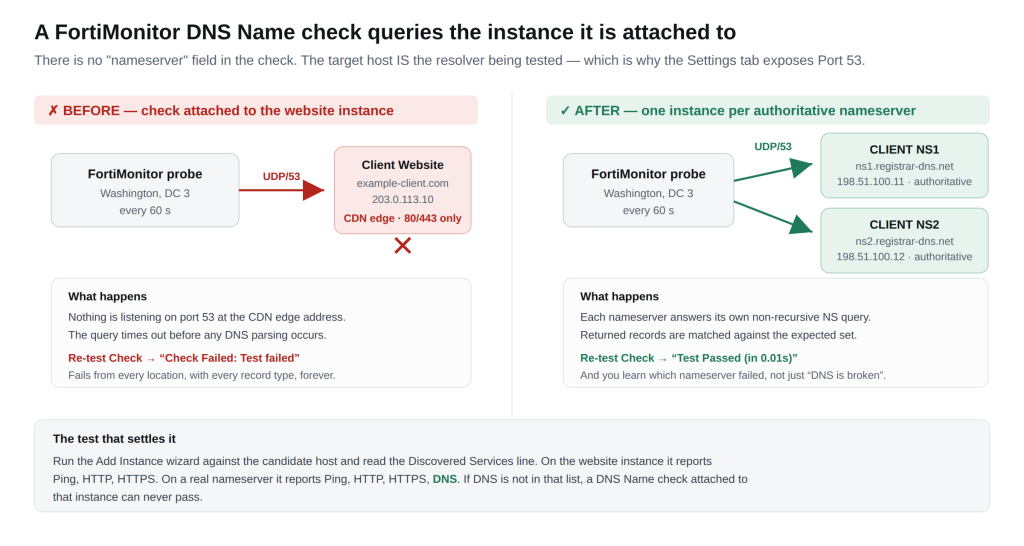
Anyone who has ever run dig or nslookup approaches a DNS test with a two-parameter mental model: ask resolver X about name Y. FortiMonitor’s DNS Name check only gives you Y. X is never typed into the check itself. It is whatever instance the metric is attached to. The Settings tab exposes a Port field (default 53) precisely because the check opens a UDP or TCP connection to that instance. There is no nameserver field anywhere in the configuration.
This design makes the DNS Name check a server check, not a free-floating record check. That is intentional and documented, but the interface never states the assumption out loud. When the check is attached to the wrong host — a CDN edge, a load-balancer VIP, or the website instance itself — the failure looks exactly the same as a wrong expected value or a mismatched record type. You open the Advanced tab, the DNS options look perfect, you re-test, it fails, you tweak the expected values or the record type, it still fails, and the real problem was never on that panel.
If you take nothing else from this post, internalize this: the instance the metric lives on is the resolver being tested. That single fact is the foundation of how to configure NS monitoring of a domain correctly in this product.
Environment and starting state
Before we started, there was a single instance in the customer’s monitoring group:
| Field | Value |
|---|---|
| Instance name | Client Website (example-client.com) |
| FQDN | example-client.com |
| Resolves to | 203.0.113.10 — a CDN edge address |
| Group path | All Instances → Acme Consulting, LLC → Acme Clients → CLIENT |
| Default monitoring location | Washington, DC 3 |
| Alert timeline | Basic notification schedule |
| Monitored since | 12 Aug 2026 |
Attached metrics included a paused DNS Name check called CLIENT NS Check (location Seattle 3, 60 s) plus working HTTP GET and HTTPS GET checks from Washington, DC 3. The fact that the DNS metric was already paused is the tell that someone had already fought with it and given up.
Opening Config → DNS metric → ⋮ → Edit showed this on the Settings tab:
| Field | Value |
|---|---|
| Name | CLIENT NS Check |
| Port | 53 |
| Monitoring Location | Seattle 3 |
| Check Frequency | 1.0 minute |
| Prevent metric override | unchecked |
And on the Advanced tab → DNS Options:
| Field | Value |
|---|---|
| Test domain | example-client.com |
| Expected Record Value(s) | ns2.registrar-dns.net,ns1.registrar-dns.net |
| DNS Record Type | NS record |
| Match any | checked |
| Non recursive | unchecked |
| Use DNSSEC Validation | unchecked |
Every one of those values is correct. That is the whole trap. Nothing on either tab is wrong, so the natural instinct — reread the DNS options, tweak the record type, retype the expected values — burns time without moving you closer. Clicking Re-test Check produced the same two-word failure every time.
Diagnosis
Confirm the expectation is not the problem
First step: establish that the expected values are actually correct so that branch of the tree can be closed off. Query the delegation from outside the monitoring system entirely.
$ dig +short example-client.com NS
ns1.registrar-dns.net.
ns2.registrar-dns.net.

$ dig +short example-client.com SOA
ns1.registrar-dns.net. namehost.registrar-dns.net. 126010708 10800 3600 604800 3600
Both nameservers in the check’s expected list are genuinely the authoritative set, and the SOA primary agrees. The expectation is right and the delegation is healthy. The failure is somewhere in how the query is being made, not what we are asking for.
The key question: what is the check actually querying?
The Settings tab exposes a Port field prefilled with 53. That is the clue. A port field only makes sense if the check is opening a connection to something — and the only host in scope is the instance the metric is attached to.
The Fortinet documentation says the same thing in the setup instructions for the DNS check: you are expected to add the IP or FQDN of the authoritative DNS servers you would like to monitor to your list of servers, and then put the check on those. So the actual query being issued every 60 seconds was, in effect:
dig @203.0.113.10 example-client.com NS # 203.0.113.10 = the CDN edge for the websiteConfirm the target does not serve DNS
203.0.113.10 is a CDN edge address. It answers 80 and 443. It does not run a nameserver. The query goes out, nothing answers, the check times out, and you get “Test failed.”
⚠️ A warning if you try to verify this from a sandboxed environment. During this investigation, a dig-equivalent from a container appeared to show the CDN address successfully answering the NS query. That was a false positive: the sandbox transparently redirects all outbound UDP/53 to its own resolver, so every IP address looks like a working nameserver. The tells were that the response had RA (recursion available) set and no AA (authoritative answer) flag — an authoritative-only server would show the opposite — and that TCP/53 to the same address timed out while UDP “worked.” If UDP/53 succeeds against an address that has no business answering DNS, suspect your own network before you trust the result.
The clean confirmation
The unambiguous test, and the one worth putting in any runbook, is FortiMonitor’s own service discovery. Run Add Monitoring → Network Device (basic), enter the candidate hostname, and read the Discovered Services line:
| Target entered | Discovered Services |
|---|---|
| example-client.com (the website) | Ping, HTTP, HTTPS |
| ns1.registrar-dns.net | Ping, HTTP, HTTPS, DNS |
DNS appears for the nameserver and not for the website. That is the diagnosis, produced by the product itself, in about thirty seconds and with no shell access required.
The fix: how to configure NS monitoring of a domain properly
Once the diagnosis is clear — the check was attached to a host that does not speak DNS — the path forward is straightforward but requires intentional design. The core principle is simple: treat each authoritative nameserver as its own monitored instance. The DNS Name check has no separate “nameserver” field; the instance the metric lives on is the target of the UDP/53 (or TCP/53) query.
Design decision: one instance per nameserver
There were two workable shapes:
| Option | Pros | Cons |
|---|---|---|
| One instance covering both NS addresses | Fewer objects to manage | An alert tells you “DNS is broken” but not which server; you lose per-server availability history |
| One instance per authoritative nameserver | Per-server availability, per-server incidents, matches the vendor’s documented model | Two objects instead of one |
We went with one instance per nameserver. For a two-nameserver delegation the extra overhead is trivial, and the diagnostic value of knowing which NS died is the entire point of monitoring them separately. If one of two nameservers goes down, resolution still mostly works — clients retry — so this is exactly the failure you want to catch early and quietly, before it becomes a full outage.
Step-by-step: creating the nameserver instances
Repeat for each authoritative nameserver.
Step 1 — open the catalog. Add (bottom-left) → Instance, or navigate directly to /onboarding/v2/. Choose Network Device (basic) → Select. This is the right template for a bare host you want reachability plus service checks on; it does not require an agent.
Step 2 — Endpoint Details.
| Field | Value |
|---|---|
| Device FQDN or IP | ns1.registrar-dns.net |
| Name | CLIENT NS1 |
| Tags | Acme, Client Group, CLIENT |
| Attributes | Client: Acme, Sub-Client: Client Group |
| Group | Acme Consulting, LLC → Acme Clients → CLIENT |
Use the Bulk Entry toggle if you are adding many nameservers at once — but note you lose per-instance naming, so for two servers it is faster to do them individually.
💡 Naming gotcha. FortiMonitor appends the FQDN to whatever display name you set. Enter CLIENT NS1 and the console renders CLIENT NS1 (ns1.registrar-dns.net). If you enter CLIENT NS1 (ns1.registrar-dns.net) you get the FQDN twice. Keep the name short.
Step 3 — Monitoring Details. Set the Primary Monitoring Location and the Alert Timeline here rather than fixing them afterwards. Instances default to a location that may not match the rest of the group (ours defaulted to Chicago while every sibling instance used Washington, DC 3), and if you leave the alert timeline on “Inherit from group” you inherit whatever the group default is — which, in our case, was an urgent paging schedule.
Step 4 — Perform Discovery. This is the diagnostic step from earlier doing double duty as a setup step. For a nameserver you should see Ping, HTTP, HTTPS, DNS.
Deselect HTTP and HTTPS. Many registrar nameservers answer on 80/443 with a redirect or a courtesy page; monitoring that is pure alert noise and tells you nothing about DNS health. Keep Ping and DNS.
Step 5 — Finish Installation. The instance is created and monitoring starts immediately, using the default DNS check configuration. Which brings us to the next problem.
Immediately fix the auto-created check — it ships broken
The DNS metric that discovery creates for you is not configured for your domain. Its defaults are:
| Field | Default value |
|---|---|
| Test domain | google.com |
| Expected Record Value(s) | (empty) |
| DNS Record Type | A record |
| Match any | unchecked |
| Non recursive | unchecked |
Against an authoritative-only nameserver, google.com is a name it is not authoritative for and will not recurse to resolve. So the brand-new check fails within one minute of creation and raises a real incident on whatever alert timeline the instance inherited. In our case that meant SMS and three emails to the on-call rotation about 90 seconds after the instance existed.
⚠️ Practical advice worth calling out: put the new instance into maintenance, or attach it to a silent timeline, before you click Finish Installation — then configure the check, then move it to the real alert timeline. Alternatively accept the noise but warn the on-call rotation first. There is no way to create the instance with a pre-configured DNS check in the wizard.
Now edit it: Config → DNS metric → ⋮ → Edit.
Settings tab
| Field | Value |
|---|---|
| Name | CLIENT NS Check (ns1) |
| Port | 53 |
| Monitoring Location | Washington, DC 3 |
| Check Frequency | 1.0 minute |
Advanced tab → DNS Options
| Field | Value | Why |
|---|---|---|
| Test domain | example-client.com | The zone you are checking delegation for |
| Expected Record Value(s) | ns1.registrar-dns.net,ns2.registrar-dns.net | Comma-separated, no spaces |
| DNS Record Type | NS record | The whole point |
| Match any | checked | Pass if any returned record is in the expected set |
| Non recursive | checked | Correct for authoritative-only servers — sends RD=0 |
| Use DNSSEC Validation | unchecked | Only tick this if the zone is actually signed |
Notes on the individual options:
- Match any — with it ticked, the check passes if any single returned record appears in your expected list. Untick it only if you want to assert the complete set matches, which makes the check brittle during planned nameserver migrations.
- Non recursive — sends the query with the recursion-desired bit clear. This is the semantically correct setting when the target is an authoritative server, because authoritative-only servers refuse recursion anyway. If you are pointing a DNS check at a caching resolver instead, leave this unticked.
- Expected Record Value(s) — for SOA checks the field supports partial matching with space-delimited key/value pairs (e.g. primary=ns1.example.com refresh=900). For NS checks it is a plain list.
Click Save.
Gotcha #1: the DNS Record Type dropdown silently reverts on save
This is the part most worth writing up, because it will bite anyone who follows the happy path of learning how to configure NS monitoring of a domain.
What happened. All six DNS Options were set correctly and saved. The re-test still failed. Re-opening the drawer and expanding Advanced → DNS Options showed five of six fields persisted correctly, but DNS Record Type had silently reverted to A record.
Why it happens. The record-type control is a custom widget, not a native select. It renders as a button plus a hidden select that mirrors the value. Setting the hidden element’s value — which is what a browser’s autofill, an accessibility tool, or automation typically does — updates the DOM but never fires the component’s own change handler, so the widget’s internal state stays on the default and that is what gets submitted. Only a real click on the visible button, then a real click on the option in the popup list, updates both.
The practical consequence for the failure we were debugging. With the type silently reverted to A, the check was asking the nameserver for example-client.com A and comparing the answer (203.0.113.10) against an expected list of nameserver hostnames. Guaranteed mismatch, and the same generic “Test failed” message as the original problem — so it looks like your fix did nothing.
Rule to state plainly: after every save on this panel, re-open Advanced → DNS Options and confirm the record type is still what you selected. Do not trust the save.
Gotcha #2: Re-test Check evaluates the saved config, not the screen
Secondary, but it will waste your time in exactly the same way.
The Test Check / Re-test Check button posts to /config/testServiceOnChecker and the check is evaluated server-side against the persisted metric configuration. Editing fields in the drawer and hitting re-test without saving first tests the old values. During this engagement that produced a re-test failure on a configuration that was, on screen, already correct — which sent us looking for a problem that no longer existed.
Order of operations that works: change → Save → re-open → Re-test Check → confirm the DNS options survived the save.
A passing response looks like the green “Test Passed (in 0.01s).” The near-zero duration on a failure is itself a hint that the check never got as far as a network round trip.
Verification
Three independent confirmations, in increasing order of trustworthiness.
- The in-drawer test. After a confirmed save and a verified record type, Re-test Check shows the green “Test Passed (in 0.01s).”
- The live metric clears on its own. Save, wait one check interval, reload the Config tab. The metric’s CRITICAL badge disappears and the open incident auto-resolves. This is the one that actually matters — the in-drawer test and the scheduled check are different code paths.
- The incident timeline shows the resolution. The original incident on the first nameserver ran 20:35:12 → 21:02:47 EDT (27m35s) and closed itself. Note the error text from the auto-created check: “Name google.com not found.” That is far more useful than “Test failed.” When the interactive re-test gives you nothing, go read the incident detail instead.
Steady-state response times settled around 30–50 ms from Washington, DC 3.
Cleanup and final state
Delete the broken metric. On the website instance: Config → DNS metric → ⋮ → Delete → I’m sure. It never worked, so nothing of value is lost. Leaving it paused would be defensible; leaving it unpaused and permanently red is how monitoring dashboards become noise people stop reading.
Align the instances. Two things drifted during setup and were corrected afterwards:
- The first nameserver instance kept its default monitoring location (Chicago) even though its DNS check ran from Washington, DC 3 — so its Ping metric and DNS metric were probing from different cities. Both were aligned to Washington, DC 3.
- The two nameserver instances landed on different alert timelines. Both were set to the urgent schedule, on the reasoning that a dead authoritative nameserver is a domain-level event and deserves to page.
Final configuration:
| Instance | FQDN | Metrics | Location | Alert timeline |
|---|---|---|---|---|
| Client Website | example-client.com | HTTP, HTTPS | Washington, DC 3 | Basic notification schedule |
| CLIENT NS1 | ns1.registrar-dns.net | Ping, DNS Name (NS) | Washington, DC 3 | Acme (Urgent) |
| CLIENT NS2 | ns2.registrar-dns.net | Ping, DNS Name (NS) | Washington, DC 3 | Acme (Urgent) |
Takeaways
Ranked by how much time each one saves the next person who needs to know how to configure NS monitoring of a domain:
- A DNS Name check tests a nameserver, not a record. The instance it is attached to is the resolver being queried. If that host does not listen on 53, no combination of DNS options will ever make the check pass. Monitor delegation by creating an instance per authoritative nameserver.
- Use service discovery as a diagnostic, not just a setup step. Running the Add Instance wizard against a hostname and reading the Discovered Services line answers “does this thing even speak DNS?” in seconds, from inside the product, with no shell.
- Re-verify the DNS Record Type after every save. It can silently revert to A record while every other field on the panel persists correctly.
- Save before you re-test. The re-test button evaluates persisted config, not what is on your screen.
- The scheduled check’s incident message is more informative than the interactive test. “Test failed” tells you nothing; “Name google.com not found” tells you exactly what to fix. When the button is unhelpful, read the incident.
- Configure new instances before they start alerting. Auto-created DNS checks default to google.com / A record and will fire a genuine incident against your real on-call rotation within one check interval.
- Tick Non recursive when the target is authoritative. Semantically correct, and it avoids depending on behaviour that authoritative-only servers do not offer anyway.
- Deselect HTTP/HTTPS on nameserver instances. Registrar nameservers often answer on 80/443 with something meaningless. Monitoring it generates noise and asserts nothing about DNS health.
Conclusion
Once you internalize that a FortiMonitor DNS Name check is always a query to the instance itself, the rest of how to configure NS monitoring of a domain falls into place. Create one instance per authoritative nameserver, set the DNS options carefully (and force the record-type dropdown to stick with a real click), save before you test, and you get clean, per-server visibility into the health of your delegation instead of a permanent red metric and a two-word error message. The hour we spent — most of it on the silent-revert bug — should save the next engineer far more.
The product works once the mental model is right and the two quiet UI behaviors are known quantities. Treat the DNS Name check as a server check, attach it to real nameservers, and the generic failure message stops being a black hole.
Documentation reference: FortiMonitor 26.2.0 User Guide — DNS. Console still lives at my.panopta.com (formerly Panopta).